File:Temperature_Bar_Chart_Africa--1901-2020--2021-07-14.png
維基百科,自由的 encyclopedia
本预览的尺寸:800 × 450像素。 其他分辨率:320 × 180像素 | 640 × 360像素 | 1,024 × 576像素 | 1,280 × 720像素 | 2,560 × 1,440像素 | 3,780 × 2,126像素。
原始文件 (3,780 × 2,126像素,文件大小:59 KB,MIME类型:image/png)
摘要
| 描述Temperature Bar Chart Africa--1901-2020--2021-07-14.png |
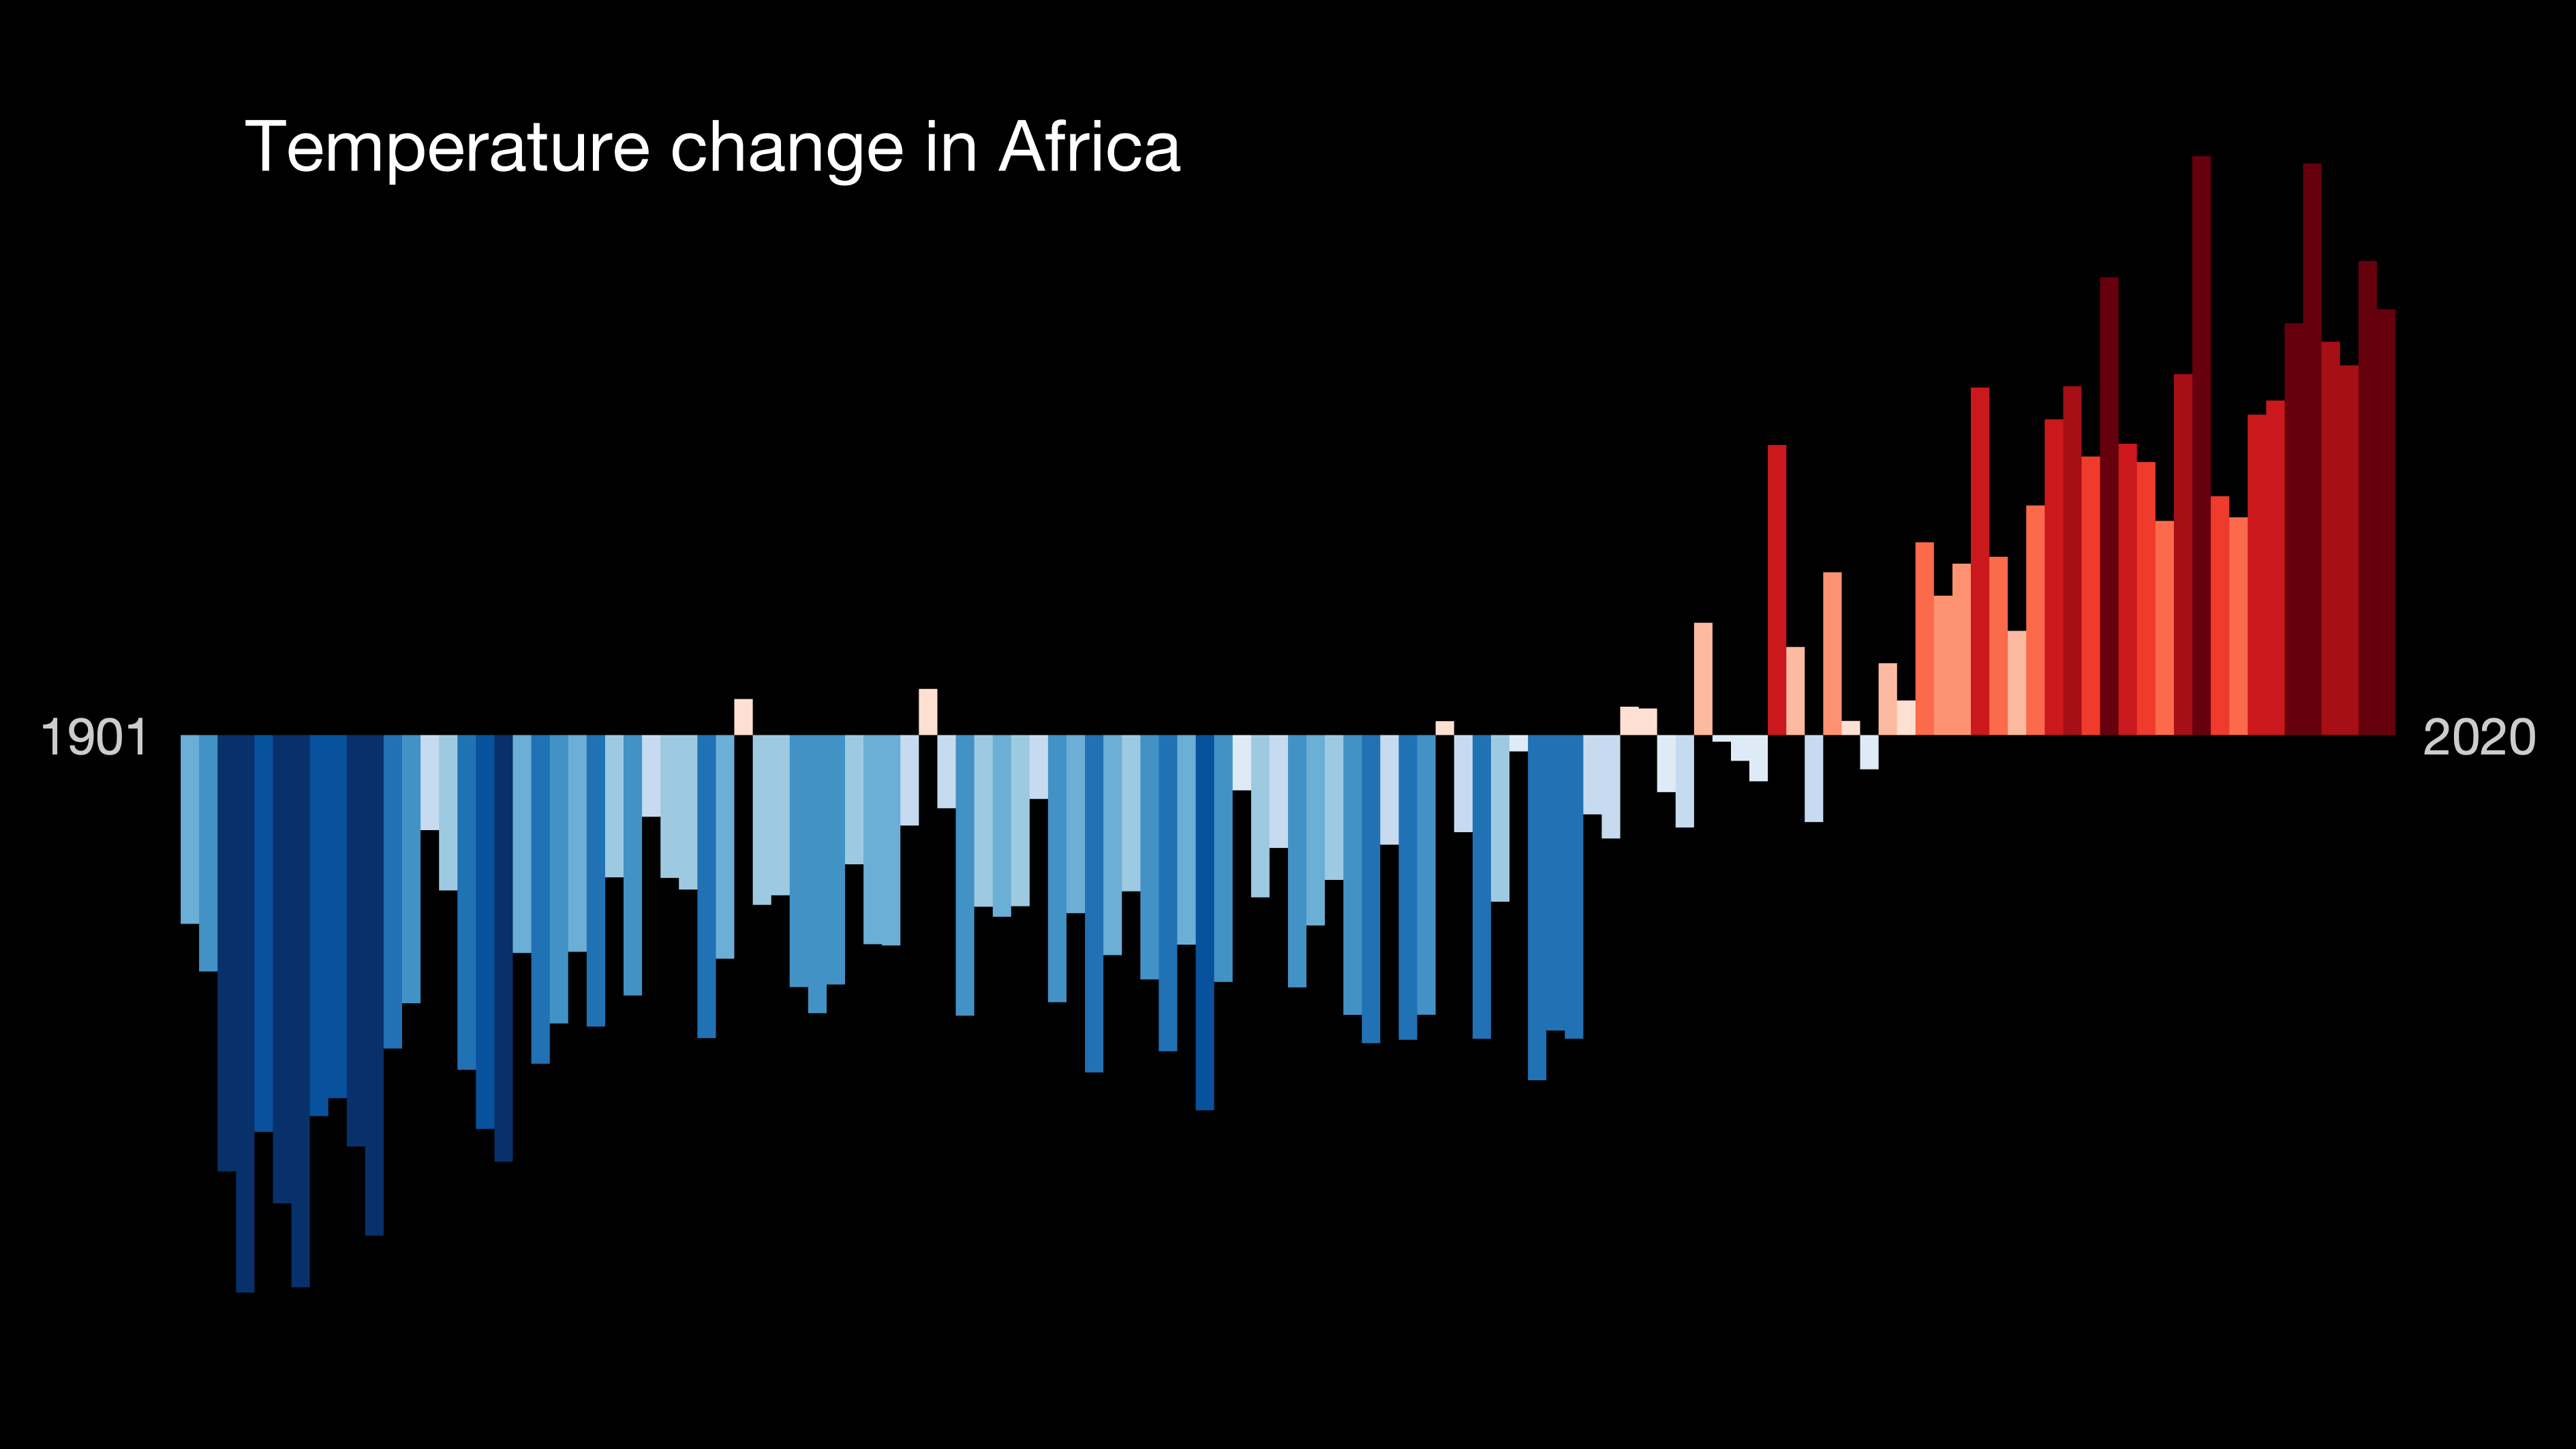
English: This bar chart is a visual representation of the change in temperature in the past 100+ years. Each stripe represents the temperature averaged over a year. The average temperature in 1971–2000 is set as the boundary between blue and red colors, and the color scale varies from ±2.6 standard deviations of the annual average temperatures between the years mentioned in the file name. Data source: Berkeley Earth. For more information visit https://showyourstripes.info/faq
Français : Graphique à barres, décrivant visuellement le changement de température durant un siècle : Chaque bande représente la température moyenne sur une année. La température moyenne de 1971 à 2000 est définie comme la limite entre les couleurs bleue et rouge, et l'échelle de couleurs varie de ± 2,6 écarts-types des températures moyennes annuelles entre les années (mentionnées dans le nom du fichier). Source : Berkeley Earth / https://showyourstripes.info/faq |
| 日期 | |
| 来源 | https://showyourstripes.info/ |
| 作者 | Ed Hawkins, University of Reading |
许可协议
说明
添加一行文字以描述该文件所表现的内容
Temperature bar chart for Africa
Graphique montrant le changement de température en Afrique entre 1901 et 2021, la couleur rouge étant plus chaude et le bleu plus froid que la moyenne (la température moyenne (1971-2000) = la limite entre les couleurs bleue et rouge).
此文件中描述的项目
描繪內容
1 7 2021
image/png
文件历史
点击某个日期/时间查看对应时刻的文件。
| 日期/时间 | 缩略图 | 大小 | 用户 | 备注 | |
|---|---|---|---|---|---|
| 当前 | 2021年7月14日 (三) 08:42 | | 3,780 × 2,126(59 KB) | DiagramLover | Uploaded a work by Ed Hawkins, University of Reading from https://showyourstripes.info/ with UploadWizard |
文件用途
以下页面使用本文件:
全域文件用途
以下其他wiki使用此文件:
- af.wikipedia.org上的用途
- en.wikipedia.org上的用途
- fr.wikipedia.org上的用途
- hy.wikipedia.org上的用途
- sl.wikipedia.org上的用途
- sr.wikipedia.org上的用途
元数据
此文件中包含有扩展的信息。这些信息可能是由数码相机或扫描仪在创建或数字化过程中所添加。
如果此文件的源文件已经被修改,一些信息在修改后的文件中将不能完全反映出来。
| 水平分辨率 | 118.11 dpc |
|---|---|
| 垂直分辨率 | 118.11 dpc |
| 文件修改日期时间 | 2021年6月2日 (三) 11:11 |
| 使用软件 | |
| 数字化日期时间 |
|